
Creator of Bollinger Bands Foresees Potential Upswing in Bitcoin Market with a 'W'-Shaped Recovery Pattern
John Bollinger, creator of the Bollinger Bands, identifies a potential bullish reversal in Bitcoin's price, as it exhibits a "W"-shaped double bottom pattern, suggesting the cryptocurrency might be nearing the end of its prolonged downtrend. This technical analysis coincides with an increase in U.S. spot Bitcoin ETF inflows, indicating a growing institutional interest that may further buoy the market.
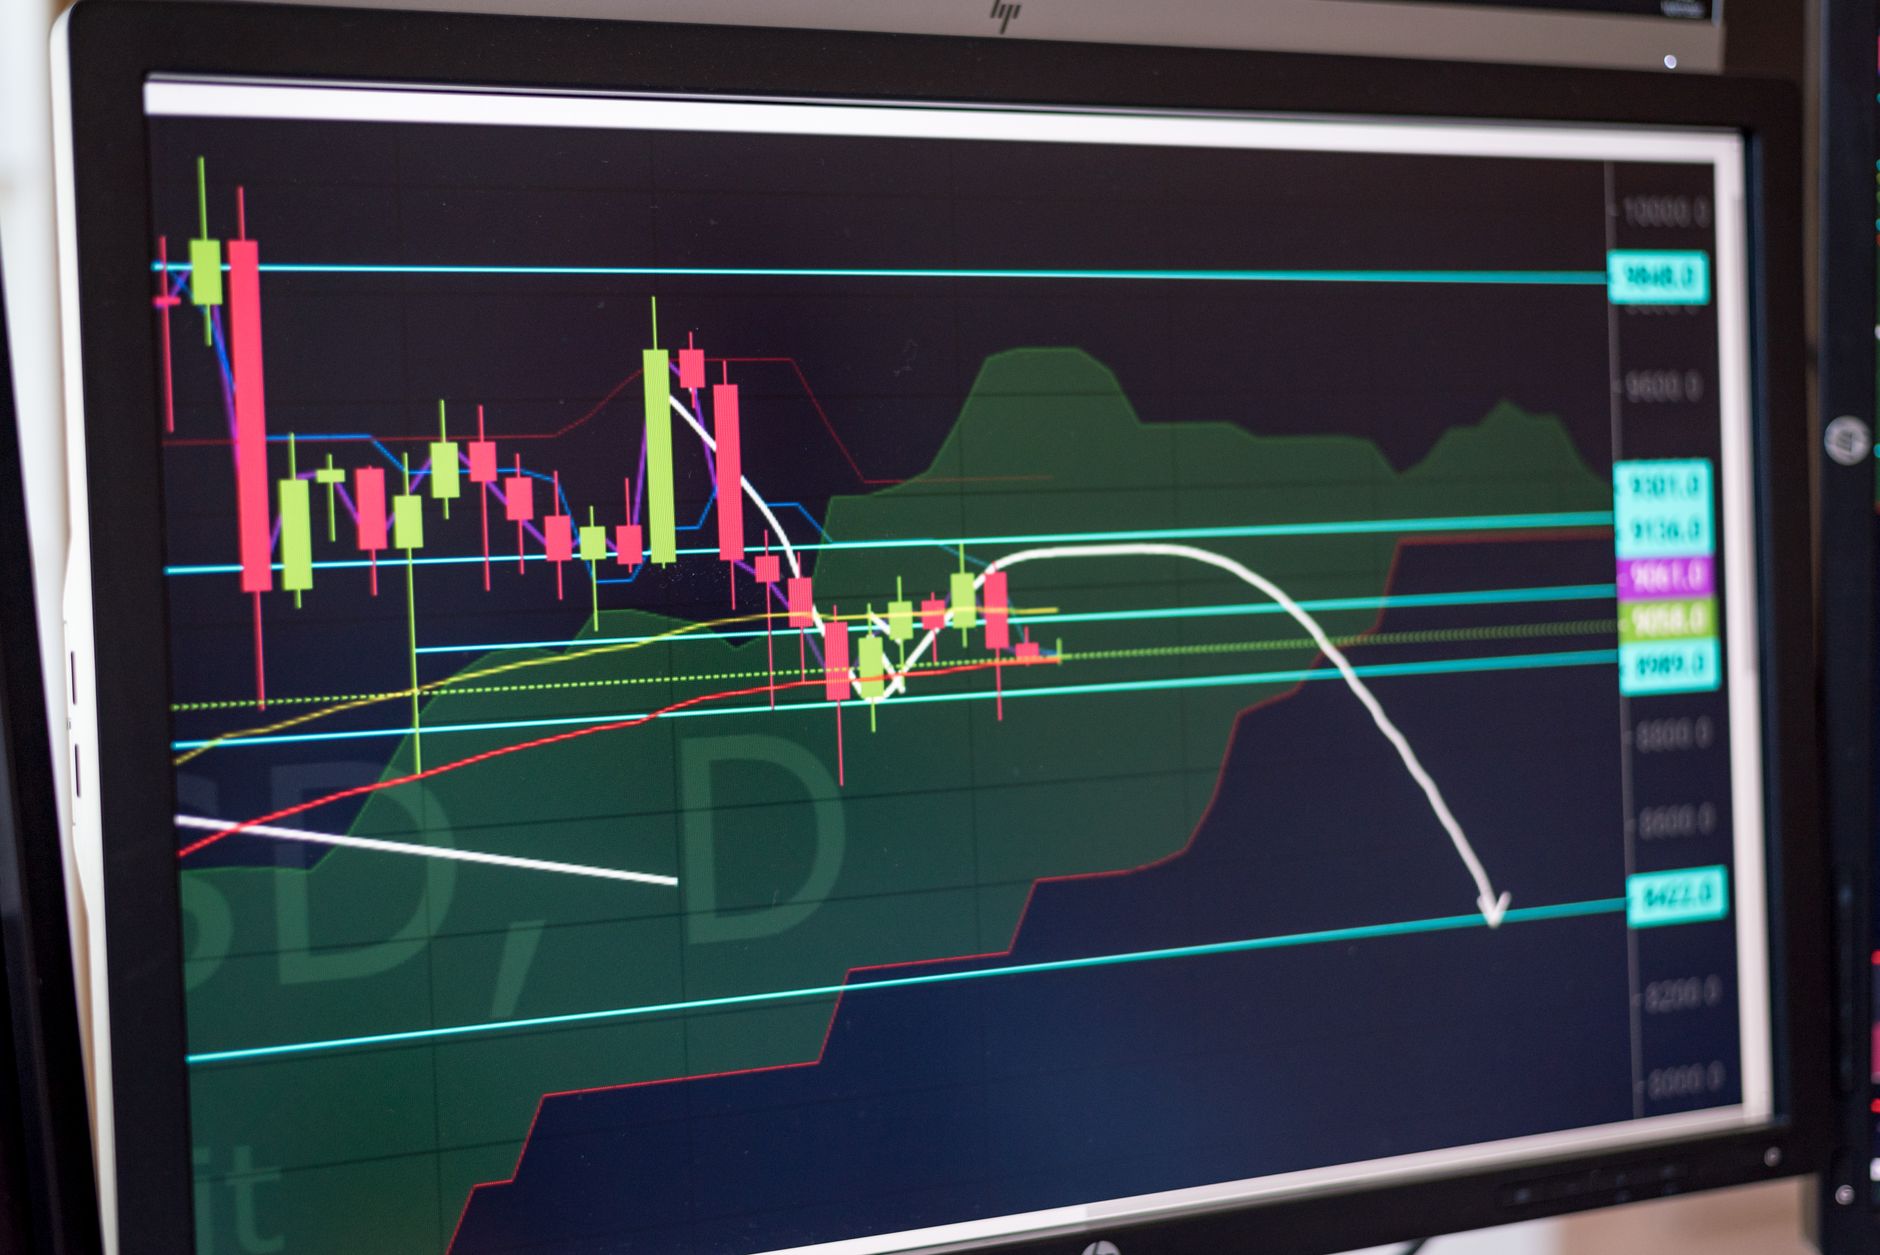
As Bitcoin bobs around the $60,000 mark, John Bollinger, the inventor of the Bollinger Bands, suggests that the cryptocurrency is forming a "W"-shaped pattern, potentially signaling an end to its months-long downtrend. This observation isn't just another tick on the chart; it represents a crucial turning point that could redefine market sentiment surrounding Bitcoin.
Bollinger’s analysis of the Bitcoin price chart shows a double bottom formation-a classic "W" shape-which traditionally indicates that a reversal is on the horizon. The pattern includes two low points with a peak in between, and it is considered complete when the price breaks past this intermediate high. With Bitcoin, the setup coincides neatly with the lower band of Bollinger Bands on daily time frames, highlighting a meticulous synchronization of technical factors that could herald a new bullish phase.
This potential upswing is underpinned by more than just chart patterns. Recently, there has been a noticeable uptick in institutional interest, as evidenced by inflows into U.S. spot Bitcoin ETFs, which saw their first net inflows in ten days. While not massive, these inflows are significant-they suggest that institutional investors may be starting to see Bitcoin as undervalued, or at least stabilized enough to warrant new positions.
The timing is intriguing as it aligns with a broader financial context where global stocks are also reaching record highs, hinting at a renewed appetite for risk among investors. For Bitcoin, whose correlation with traditional risk assets can vary wildly, this could mean that its price movements are not operating in isolation but are reflecting larger economic sentiments.
Furthermore, the structural market movements indicated by on-chain analytics, such as the re-emergence of buyer interest and major supply absorption, hint at underlying strengths. These movements often go unnoticed in the flashy day-to-day trading headlines but are crucial for understanding long-term trends.
Yet, as any seasoned observer of cryptocurrency markets will tell you, predicting Bitcoin's mood swings is no small feat. The inherent volatility and speculative nature of the market make any pattern recognition an exercise in probability rather than certainty. Thus, while the "W" pattern is a strong bullish signal, it is by no means a guarantee-investors should keep an eye on other market factors and global economic indicators that could influence cryptocurrency prices.
For those intrigued by the technical and institutional movements shaping Bitcoin’s trajectory, these developments could serve as a bellwether for both immediate trading strategies and longer-term investment decisions. Whether this "W" marks the spot for a turnaround could very well depend on broader market dynamics, but as things stand, it's a flicker of optimism in what has been a dark few months for Bitcoin enthusiasts.